jHeatmap
Interactive web heatmap viewer built with JavaScript
- Examples
- Download
- Documentation
- Integration
-
- BioJS is a registry of JavaScript libraries and aims to provide all biological data on the web. jHeatmap is also a part of the BioJS registry and is installed automatically with BioJS
- IPython Notebook is a web-based interactive computational environment where you can combine code execution, text, mathematics, plots and rich media into a single document. We have written a python wrapper for representing DataFrames as heatmaps with jHeatmap. You may find the code and installation instructions at the jHeatmap-iPython repository
Citation
jHeatmap is designed for incorporation into web portals and applications so it has the above listed extension points which may be adapted to the developer's needs: data readers, cell decorators, data aggregation, sorting algorithms and filters.
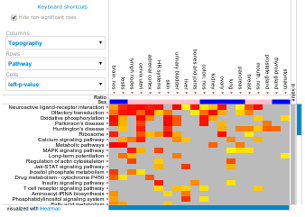
Three data readers which allow to read tab separated data into the heatmap and annotations respectively are available. A decorator is a function that defines the color scale to use in the heatmap cells. jHeatmap comes with seven implementations fit for different data types. An aggregator is a function that collapses an array of numbers (rows or columns) into a single number. Aggregators are used in combination with the default sorter. Custom complex sorters are also possible, such as the already available MutualExclusiveSorter. Filters can be added to rows and columns as for example the non-significance filter will hide rows or columns that contain no significant p-values.
